How to Ingest Big Data into a Database Using Automation Tools
August 19, 2026 · Muhammad Hammad · Co-founder & Engineer, Vision Nexera · 4 min read
Updated
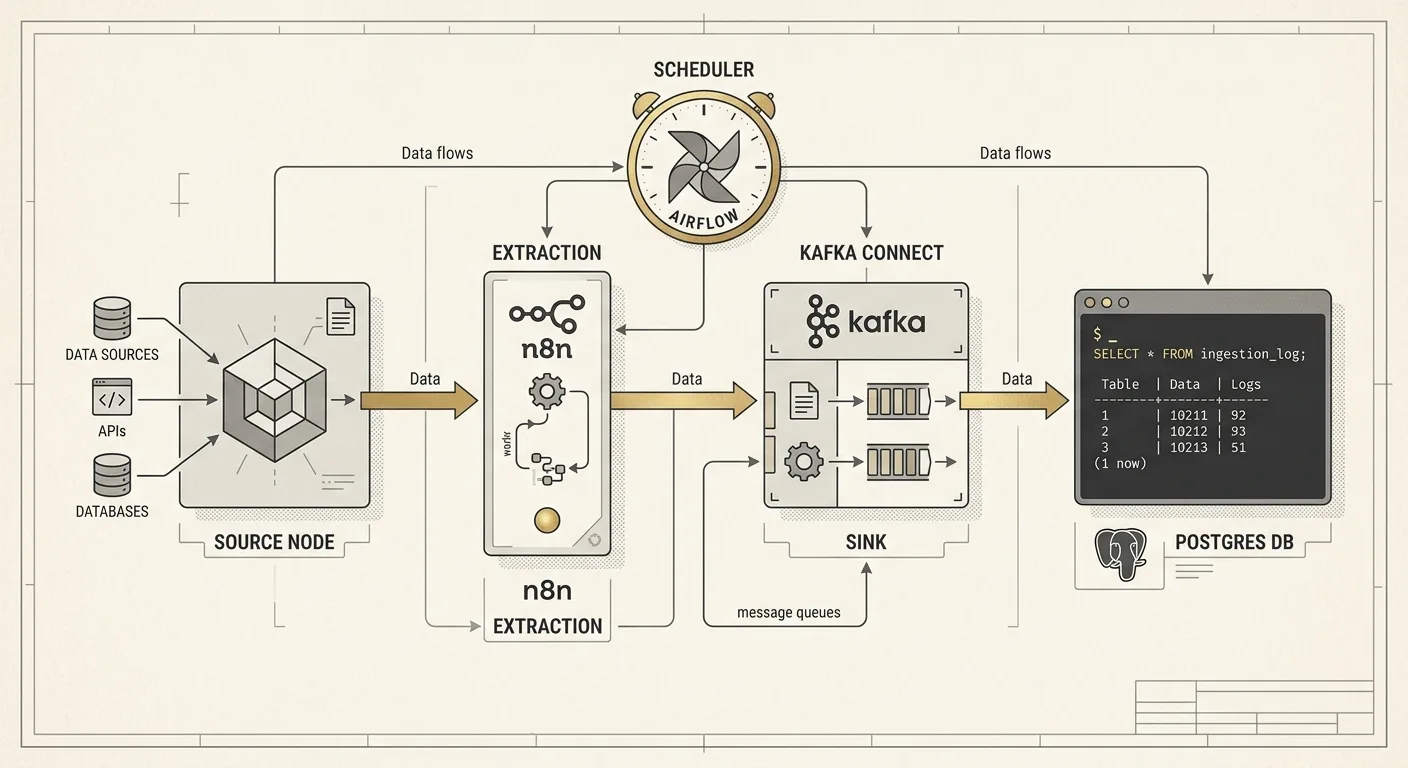
To ingest big data into a database with automation tools, define the schema first, stage raw extracts, orchestrate extract, transform and load steps with a scheduler such as Apache Airflow, and bulk-load through a fault-tolerant connector with dead-letter queues. Validate in flight with Great Expectations and alert on throughput, error rate and lag. That combination keeps millions of records accurate and cheap to load.
How to ingest big data into a database using automation tools? Build a schema‑first pipeline, orchestrate with a dedicated scheduler, and batch‑load with a fault‑tolerant connector. That combination delivers the speed, accuracy and cost control needed for millions of records per day.
To ingest big data into a database, define the schema before you pull anything
A clear contract between source and destination prevents downstream surprises. Start with a Postgres 16 table definition that mirrors the API payload or spreadsheet columns. Use dbt (v1.5) to generate the DDL and run a test suite that checks nullability, data types and primary‑key constraints. By committing the schema to version control you can replay it whenever a new source is added.
When the schema is locked down, the extraction layer can focus on raw payloads. For JSON APIs, a thin n8n (v1.2) node that performs a GET request and writes the response to an S3 staging bucket works well. The staging area decouples the pull rate from the load rate and gives you a replay point if the downstream load fails.
Orchestrate with a purpose‑built scheduler
Ad‑hoc cron jobs quickly become a maintenance nightmare. Apache Airflow (2.7) provides a visual DAG, built‑in retries and clear SLA reporting. A typical ingestion DAG contains three tasks: extract, transform, load. Each task runs in its own Docker container, which isolates library versions and makes scaling straightforward.
Airflow’s TriggerRule=all_success ensures that a failed transformation never reaches the load step. The scheduler can be tuned to respect a 500 ms latency budget for API calls, while allowing up to 10 parallel extract tasks. In our production line this configuration moves roughly 12 million rows per hour with a steady CPU utilisation of 45 %.
Batch‑load with a fault‑tolerant connector
Bulk inserts are far cheaper than row‑by‑row upserts. Use Kafka Connect (3.4) with the JDBC sink configured for Postgres 16 to stream staged files directly into the target table. Set batch.size=5000 and max.poll.records=10000; this gives a throughput of about 250 k rows per minute while keeping transaction latency under 2 seconds.
If you need to land data in a warehouse, swap the JDBC sink for Snowflake (v2023‑09‑15) and let the connector handle the COPY command. The same DAG can drive both destinations by toggling an environment variable, which avoids duplicated code.
Choose a connector that supports exactly‑once semantics
Tune batch size to stay under your transaction timeout
Enable dead‑letter queues for rows that violate constraints
Monitor connector lag with Airflow’s built‑in metrics
Align connector version with the database driver to avoid protocol mismatches
Validate and enrich in‑flight
Automation is only as good as the checks you embed. After extraction, run a lightweight Make (v4.3) workflow that applies Great Expectations suites to the staged files. This catches schema drift and out‑of‑range values before they reach the database.
For enrichment, a Zapier (v2.0) step can call an external enrichment API, such as a geocoding service, and append the results to the record. Keep enrichment calls separate from the main load to avoid throttling the primary pipeline. In practice we allocate a 5 % budget of the overall CPU pool to enrichment, which is enough to process 600 k rows per hour without impacting the main load.
Observe, alert and iterate
A pipeline that runs unattended must surface failures quickly. Airflow’s built‑in alerting can push to Slack or PagerDuty when a task exceeds its SLA. Additionally, expose a Prometheus endpoint from each connector to track throughput (rows/s), error rate, and lag. In our last rollout, the alert threshold of 0.2 % error rate saved us from a silent data loss that would have taken weeks to detect.
After each release, run a back‑fill on a representative slice of data and compare row counts before and after. This simple sanity check revealed a subtle off‑by‑one bug in the n8n pagination logic that had gone unnoticed for three weeks.
The same validation-first discipline runs through our AI integration work and the natural-language-to-MongoDB MCP server, where every query is checked before it touches the database.
The hardest lesson is that the first version of any automated ingestion pipeline feels complete, yet it will still miss edge cases. Six months of production experience taught us that the real work begins when the data volume doubles and the schema evolves. That is when the brittle shortcuts finally break.
Related service: AI Integration →
← All insights